With the emergence of coronavirus variants and continued concerns about the state of the economy, the travel and tourism industry continues to face an uncertain recovery. But one segment of the industry has fared well during the pandemic: camping, RVing, and other forms of outdoor recreation.
After much of the world shut down in early 2020 to slow the spread of COVID-19, many people were eager to travel, but continued caution around the virus made it challenging to do so. Many states and international destinations placed limits on who could visit and under what conditions. Indoor attractions, along with restaurants, hotels, and other hospitality businesses, were operating at reduced capacity due to COVID-related public health restrictions. Subsequent surges in COVID-19 cases led to renewed restrictions in some areas and made travelers reconsider their plans.
These conditions brought new appeal to an old-fashioned approach: camping and other forms of outdoor recreation. Outdoor activity is lower-risk in terms of potential coronavirus exposure, and campers are less dependent on hospitality businesses than other travelers. These qualities led to new visitation records for many national parks and other major outdoor recreation destinations in 2020. And many of those who took interest in camping were new, with an estimated 10.1 million American households camping for the first time last year, according to KOA.

While the pandemic has certainly increased the appeal of camping and outdoor recreation in the last 18 months, Google Trends data confirms that interest has in fact been growing rapidly for longer than that. Overall search interest in RVing was flat or on a slight decline for most of the 2000s and early 2010s. In more recent years, interest has grown rapidly, reaching an all-time high in 2020. Now, search interest in RVing during off months is comparable to peak season search interest from a decade ago.
This interest is also apparent across different demographic groups. The population of older Americans—who have long been a major segment of the RV market—is growing with more Baby Boomers reaching retirement age. But demand for RVs is also strong among Millennial and Gen Z consumers drawn to outdoor experiences and a more flexible lifestyle. Around two in five RV owners are aged 18 to 44, showing that camping and RVing have wide appeal.
TRENDING
California is full of places to explore by RV, and its mild winters make for an excellent time to hit the road. Take a look at the best RV rentals in Los Angeles.
While overall interest has increased, camping and outdoor recreational activities still follow seasonal patterns, with most campers venturing outdoors during the summer months when temperatures are warmer. However, many states have excellent camping options year-round. States across the West and South offer temperate winter climates, less precipitation, and ample natural attractions and parklands to entice outdoor recreation enthusiasts.
To find the best states for warm weather winter camping, researchers at Outdoorsy created a composite score based on the average maximum temperature, average minimum temperature, average monthly precipitation, and total land area allocated to parks and wildlife. Weather statistics are long-term averages for December–February, sourced from NOAA, and land area statistics are from the USDA. In the event of a tie, the state with the higher average winter maximum temperature was ranked above.
Here are the 10 best states for warm winter camping.
The 10 best states for warm winter camping
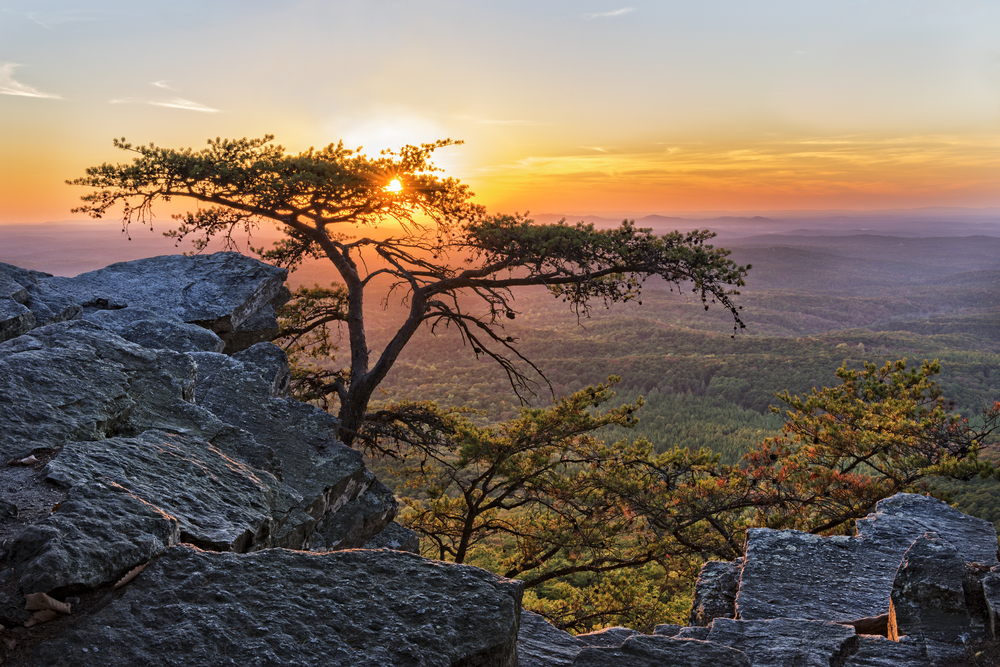
10. Alabama
- Composite index: 62.6
- Average maximum temperature: 57.7
- Average minimum temperature: 35.3
- Average monthly precipitation (inches): 5.2
- Total parks and wildlife area (acres): 548,000

9. Georgia
- Composite index: 67.5
- Average maximum temperature: 58.6
- Average minimum temperature: 35.9
- Average monthly precipitation (inches): 4.3
- Total parks and wildlife area (acres): 747,000
RELATED
Home to the world’s longest continuous waterfront sidewalk, Tampa is a beautiful place to explore by RV. To get your trip started, be sure to check out our guide to RV rentals in Tampa.
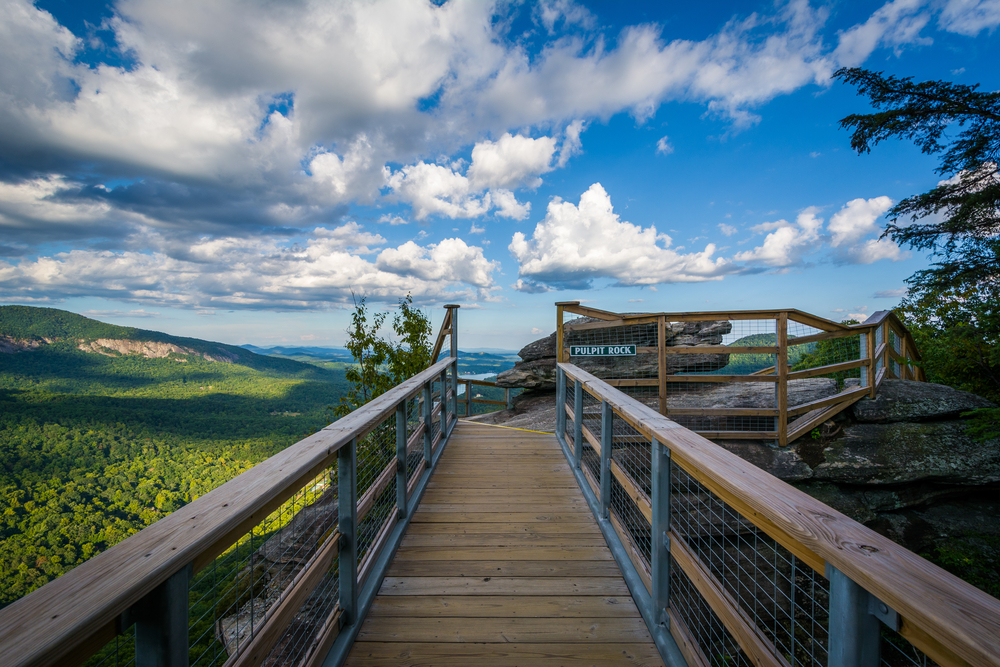
8. North Carolina
- Composite index: 67.8
- Average maximum temperature: 51.9
- Average minimum temperature: 30.3
- Average monthly precipitation (inches): 3.8
- Total parks and wildlife area (acres): 1,575,000
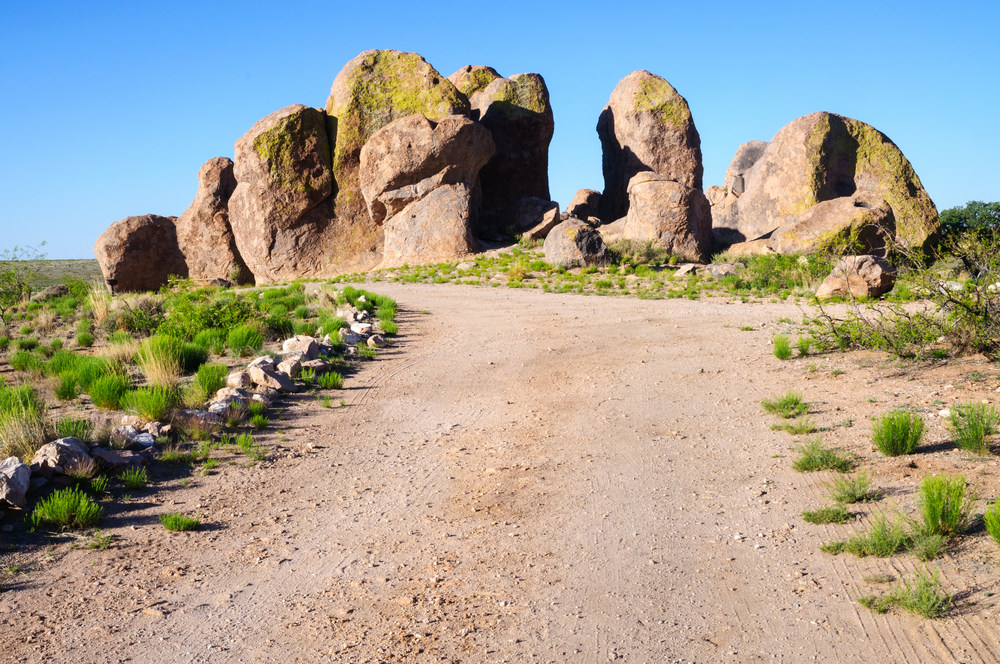
7. New Mexico
- Composite index: 69.9
- Average maximum temperature: 49.3
- Average minimum temperature: 21.2
- Average monthly precipitation (inches): 0.7
- Total parks and wildlife area (acres): 2,720,000

6. Nevada
- Composite index: 70.5
- Average maximum temperature: 42.8
- Average minimum temperature: 20.7
- Average monthly precipitation (inches): 1.1
- Total parks and wildlife area (acres): 6,580,000
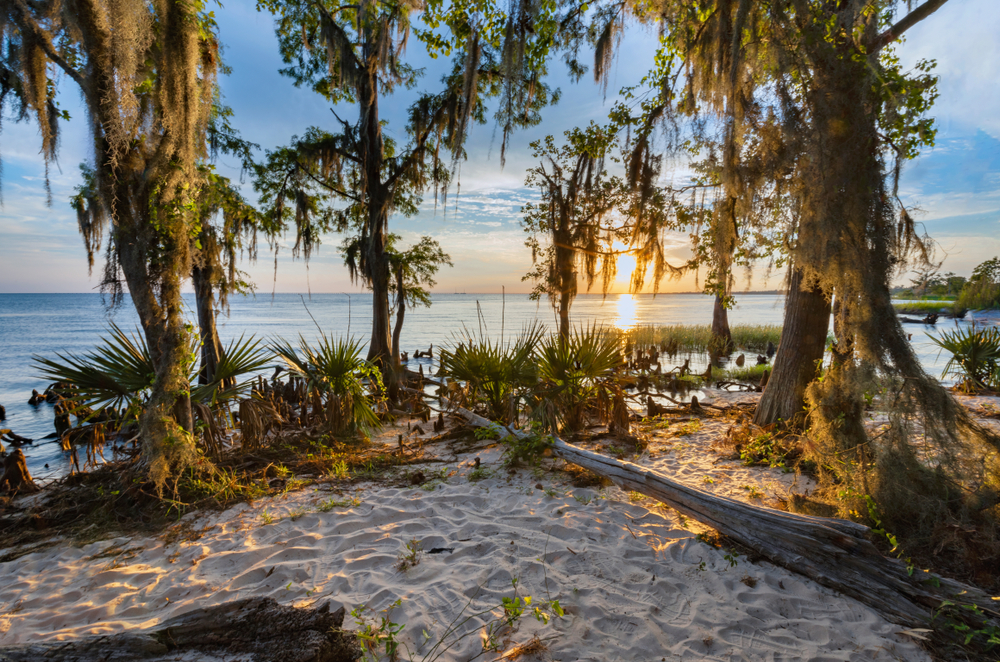
5. Louisiana
- Composite index: 74.5
- Average maximum temperature: 61.4
- Average minimum temperature: 40.4
- Average monthly precipitation (inches): 5.1
- Total parks and wildlife area (acres): 1,276,000

4. California
- Composite index: 79.3
- Average maximum temperature: 53.5
- Average minimum temperature: 33.6
- Average monthly precipitation (inches): 3.9
- Total parks and wildlife area (acres): 19,623,000
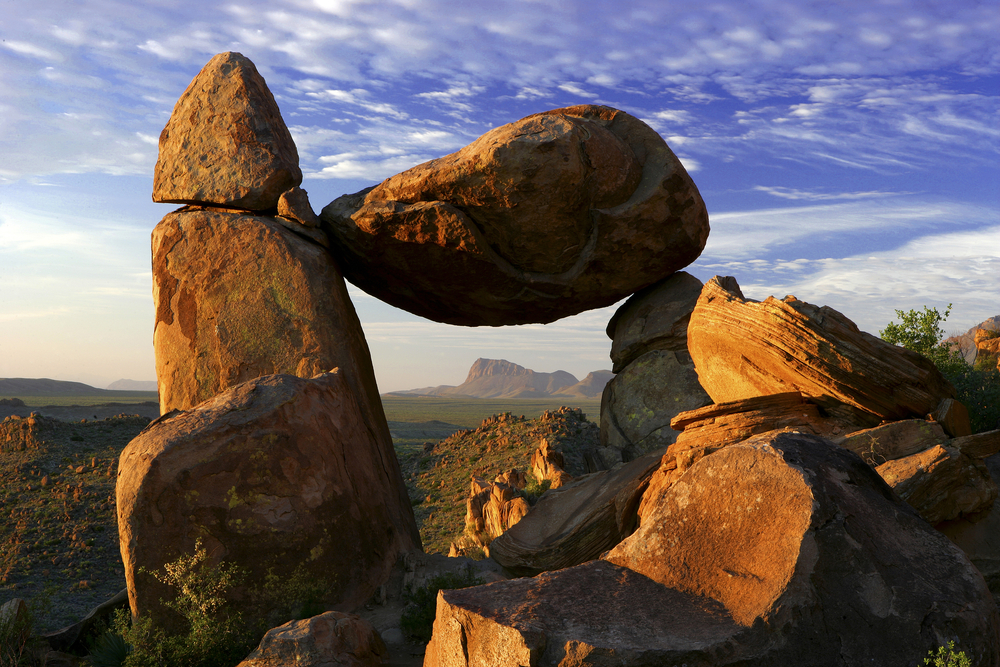
3. Texas
- Composite index: 83.3
- Average maximum temperature: 59.7
- Average minimum temperature: 34.9
- Average monthly precipitation (inches): 1.6
- Total parks and wildlife area (acres): 3,167,000
TRENDING
San Diego is blessed with 70 miles of glorious coastline perfect for surfing, cycling, and exploring by RV. Check out our RV rentals in San Diego guide, and start planning your trip soon!
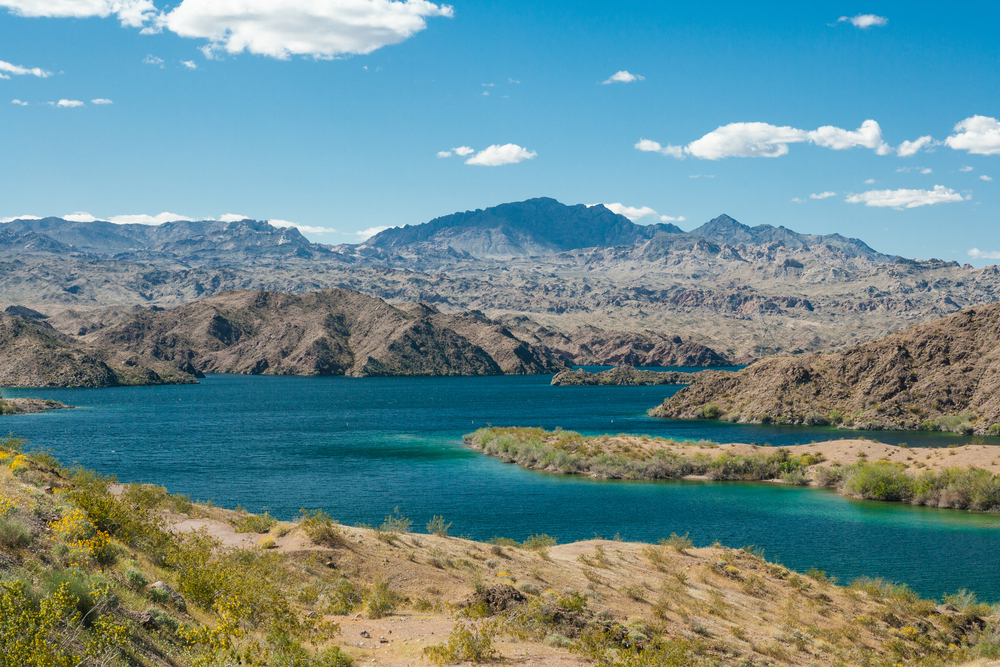
2. Arizona
- Composite index: 85.7
- Average maximum temperature: 54.9
- Average minimum temperature: 29.7
- Average monthly precipitation (inches): 1.2
- Total parks and wildlife area (acres): 7,704,000
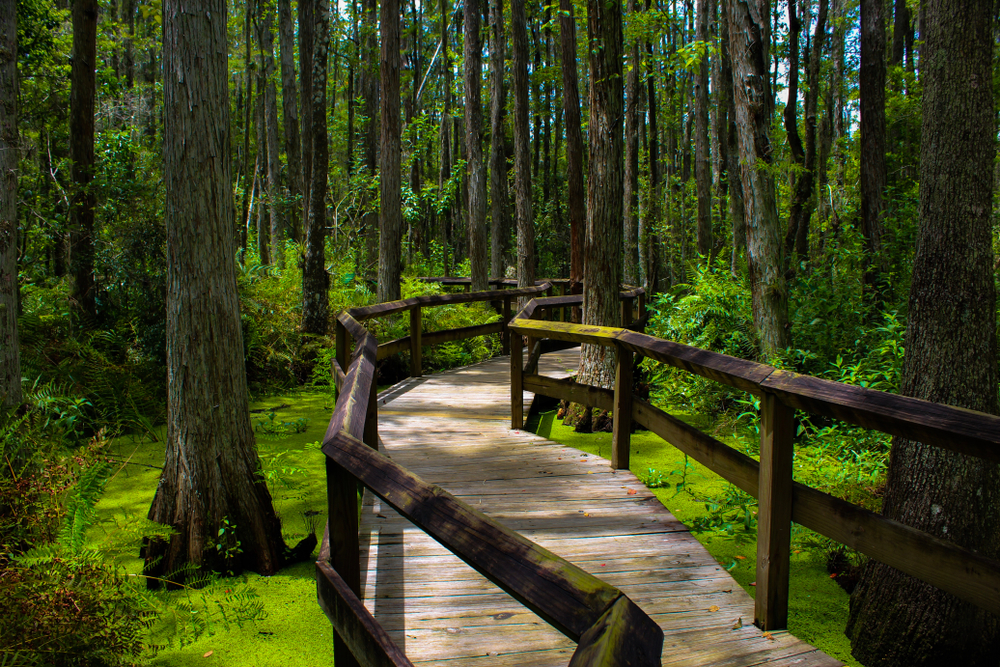
1. Florida
- Composite index: 87.5
- Average maximum temperature: 69.9
- Average minimum temperature: 47.4
- Average monthly precipitation (inches): 2.9
- Total parks and wildlife area (acres): 3,920,000
Methodology & Detailed Findings
To find the best states for warm weather winter camping, researchers created a composite score based on the following metrics:
- Average maximum temperature
- Average minimum temperature
- Average monthly precipitation (lower is better)
- Total land area allocated to parks & wildlife
Weather statistics are averages for December–February, sourced from NOAA’s Climate Normals dataset. Land area statistics are from the USDA’s Major Land Uses dataset. In the event of a tie, the state with the higher average winter maximum temperature was ranked above.


